

About the author
 Octavia Cephalo
Brand Ambassador
Brand Ambassador
Featured Article

Recent Posts


You did it. The new year is underway, and you’ve successfully launched a major project, right? A website redesign, a visual rebrand, or perhaps both. The aesthetic results are stunning, and your team is energized. But a silent question always looms large over any high-cost creative endeavor: Was it worth the investment?
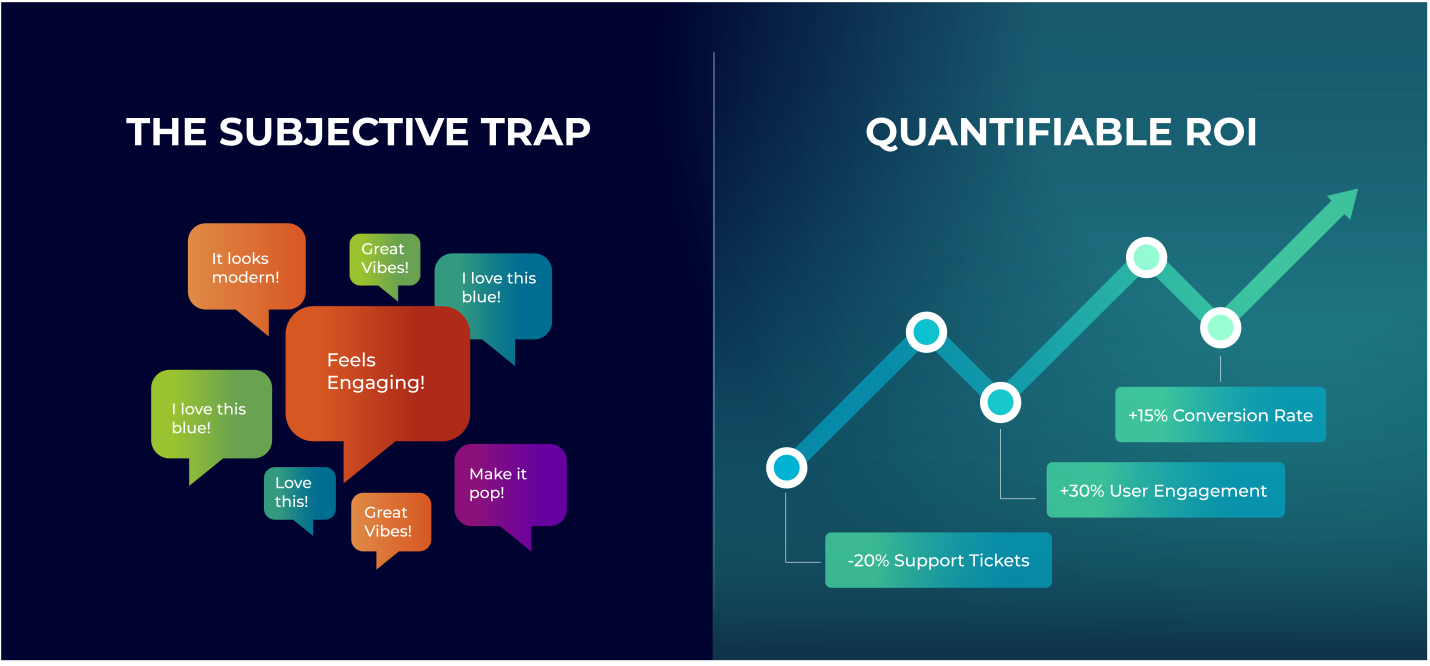
Too often, executive teams rely on subjective feedback and vanity metrics (like compliments on the new design) to gauge success. Compelify believes that a rebrand or website facelift is an investment in your primary revenue engine, and its value must be proven by quantifiable results. Without clear measurement, you can’t justify the resources spent, nor can you optimize the asset you just built.
As we move further into the year, it’s time to stop admiring the new look and start rigorously examining its financial and strategic impact.
Why Measurement is Mission-Critical
A website redesign is meant to solve the problems identified in the audit: improving clarity, removing friction, and aligning perception with reality. Measuring ROI helps you understand which solutions are working and, crucially, which areas need further A/B testing and iteration.
Your post-launch tracking should compare data from the three-month period before the launch (the Baseline) to the three-month period immediately after the launch (the Impact Period). Here are the 7 mission-critical metrics Compelify recommends tracking:
1. Core Conversion Rate (CVR)
This is the most direct measure of success. The primary goal of any website facelift is to reduce friction and guide users toward the intended action.
- What to Track: The percentage of visitors who complete your defined primary goal (e.g., booking a demo, purchasing a product, or filling out a contact form).
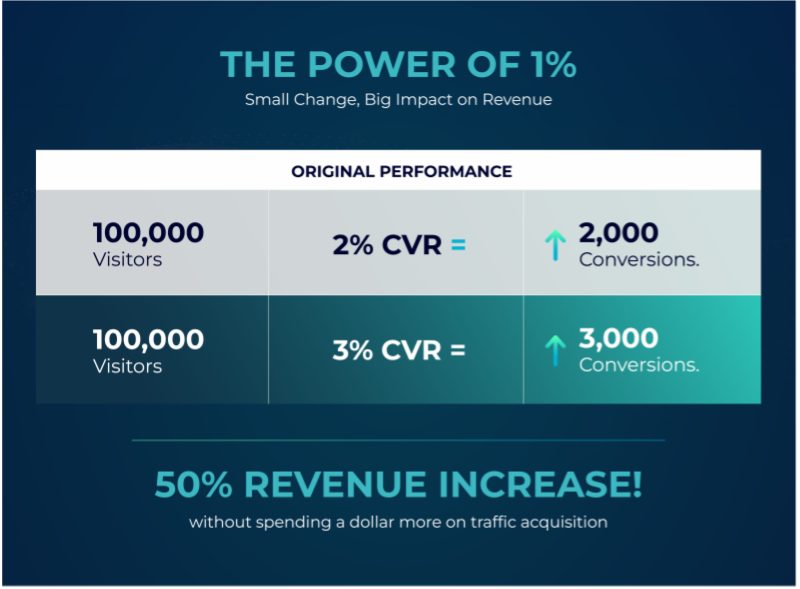
- Why it Matters: A lift in CVR proves the new User Experience (UX) and Clarity of your value proposition are working. A 1% increase in CVR can translate to hundreds of thousands of dollars in annual revenue without spending another dollar on traffic acquisition [2].
2. Branded Search Volume & Direct Traffic
A strong visual identity should increase brand recognition and make your company more memorable. This is reflected in how people find you.
- What to Track:
- Branded Search Volume: The number of Google searches for your company name or related brand terms (e.g., “Compelify agency”).
- Direct Traffic: Visitors who type your URL directly into the browser.
- Why it Matters: A lift in both indicates that your new, modern aesthetic is more memorable, credible, and easier to recall, validating the investment in a cleaner, more professional visual system.
3. Time on Site & Pages Per Session
These engagement metrics tell you whether the new information architecture (IA) and overall design are holding user attention and encouraging deeper exploration.
- What to Track: The average duration of a visit and the average number of pages a user navigates through before exiting.
- Why it Matters: A well-designed site provides a clearer, more appealing journey. If these metrics drop, it suggests the new site is confusing, slow, or fails to satisfy user intent, despite looking better.
4. Bounce Rate
The bounce rate measures the percentage of visitors who leave your website after viewing only one page.
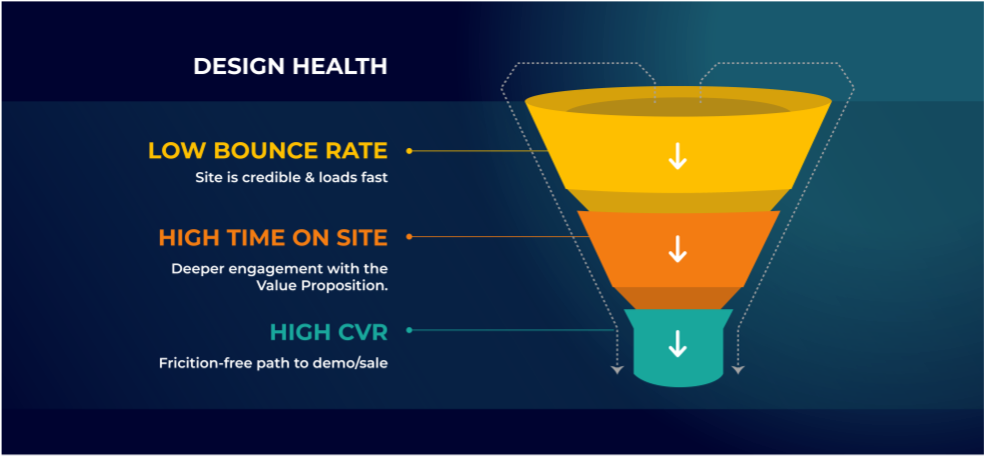
- What to Track: Your overall site bounce rate, paying special attention to high-traffic landing pages.
- Why it Matters: A lower bounce rate indicates the new design is immediately credible and loads quickly, and that the page content aligns perfectly with the marketing channel (e.g., Google Ad) that brought the user there. A high bounce rate means you’re paying for traffic that your new site immediately repels [5].
5. Lead Quality Score (LQS)
For B2B companies, collecting more leads isn’t enough; you need better leads. A refined brand often attracts a more sophisticated, better-fitting customer.
- What to Track: Work with your Sales team to apply a standardized lead scoring model (based on company size, title, or declared budget) to leads generated post-launch.
- Why it Matters: The new brand messaging should be highly targeted, effectively pre-qualifying leads. If your LQS increases, it proves the rebrand successfully refined your target audience perception, leading to a better sales cycle and improved sales velocity.
6. Support Ticket Volume for Website Issues
An unexpected but crucial metric, this reflects whether the new website is confusing or difficult to navigate.
- What to Track: The number of inbound support tickets related to finding information, broken links, or difficulty completing forms/transactions.
- Why it Matters: A well-executed UX redesign should dramatically reduce these friction points. If support tickets related to the site’s function spike, it means the development team failed to prioritize intuitive user flow and testing [4].
7. OrganiKeyword Rankings (The Technical Health Check)
A redesign often involves backend structural changes. If your technical SEO is mishandled, your ROI will be negative, regardless of the visual improvements.
- What to Track: The rankings for your top 5-10 core non-branded keywords.
- Why it Matters: A successful launch requires a flawless technical migration (301 redirects, speed optimization, core web vitals). If you see a dip in rankings, it means the technical foundation of the new site is broken, and immediate remediation is necessary to save your traffic [3].
Turning Metrics into Momentum
A website facelift is not the finish line; it’s a strategic checkpoint. By tracking these 7 metrics, you move beyond subjective opinions and gain the objective data required to manage your digital asset effectively.
If you’re seeing positive lifts in CVR and Lead Quality, congratulations—your investment is paying off. If metrics like Bounce Rate or Branded Search Volume are stagnant, the Compelify team can step in with an iteration plan, using A/B testing to refine your messaging and UX until your new site is performing as the conversion machine it was designed to be.
Don’t let the “New Year, New Momentum” fade. Use this checklist to prove your rebrand ROI and drive growth throughout the year.
Ready to understand the real impact of your new digital face?
[→ Schedule a Post-Launch ROI Audit with Compelify]
https://compelify.com/lp/newyearnewmomentum
References
[1] Lucidpress. (n.d.). The importance of brand consistency: An ROI study. (Refers to data on consistent branding and revenue increase).
[2] VWO. (n.d.). Measuring Conversion Rate Optimization Success. (Refers to industry benchmarks and strategies for CVR tracking).
[3] Search Engine Journal. (n.d.). Monitoring SEO Performance Post-Redesign. (Refers to best practices for tracking keyword rankings and technical health).
[4] Baymard Institute. (n.d.). Research on Usability and Support Tickets. (Refers to data linking site friction to inbound customer support requests).
[5] Marketing Experiments. (n.d.). The Science of Conversion. (Refers to general principles linking UX clarity to lower bounce rates).